Azure Arc

Interesting changes to Arc Agent 1.34 with expanded detected properties

Microsoft just pushed out a change in Azure Arc Connected Agent 1.34 and with this comes some enrichment of Hybrid Servers detected properties.

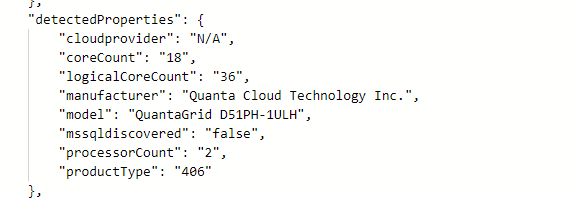
This is what the properties looked like prior to the update.

Agent 1.33 and earlier

Okay… so what’s new and different?

New detected properties for Azure Arc Connected Agent 1.34

serialNumber, ProcessNames and totalPhysicalMemory

resources
| where ['type'] == "microsoft.hybridcompute/machines" 
| extend processorCount = properties.detectedProperties.processorCount,
    serialNumber = properties.detectedProperties.serialNumber,
    manufacturer= properties.detectedProperties.manufacturer,
    processorNames= properties.detectedProperties.processorNames,
    logicalCoreCount = properties.detectedProperties.logicalCoreCount,
    smbiosAssetTag = properties.detectedProperties.smbiosAssetTag,
    totalPhysicalMemoryInBytes = properties.detectedProperties.totalPhysicalMemoryInBytes,
    totalPhysicalMemoryInGigabytes = properties.detectedProperties.totalPhysicalMemoryInGigabytes
| project name,serialNumber,logicalCoreCount,manufacturer,processorCount,processorNames,totalPhysicalMemoryInBytes,totalPhysicalMemoryInGigabytes

This unlocks organizations to collect processor, serial number and memory information in a simple fashion via Azure Arc infrastructure. This can be used to look at things like consolidation and migration planning, perhaps decommissioning aging hardware even warranty lookup if you don’t have current hardware CMDB.

Azure Monitor Container Insights cost presets (preview)

Microsoft have recently added a new preview feature within the Azure portal to perform some cost optimization on the Container Insights data that is collected to a Log Analytics workspace. This is helpful as going with the default collection could leave you with unnecessary cost, as you don’t care about particular namespaces, or you’ve got a non-production cluster, so don’t care about collecting data every minute, but still want to monitor your cluster and workloads.

Here’s how you can quickly set this up.

  • From the Azure Portal, open up the blade for your Kubernetes resource (works for both AKS and Arc enabled Kubernetes

  • Navigate to Monitoring / Insights and then Configure azure monitor (If you’ve not previously enabled it)

If you have configure container insights previously, click on Monitor Settings :

From the blade that’s opened, you’ll need to make sure that Use Managed Identity (preview) is enabled. This appears for Azure Arc for Kubernetes enabled clusters. If this isn’t checked, you will find the Costs presets (preview) list box is grayed out.

From the list box, you can choose from the following profiles:

  • Standard

  • Cost-optimized

  • Custom

  • None

Standard profile has the following settings:

  • 1 minute collection frequency

  • No namespace filtering

  • Syslog collection disabled

Cost-optimized profile has the following settings:

  • 5 minute collection frequency

  • 3 namespaces excluded [kube-system, gatekeeper-system, azure-arc]

  • Syslog collection disabled

You can use the defined standards as the basis for your own custom collection profile.

Select a profile from the drop down and click on Edit collection settings.

You can now modify the configuration to meet your requirements. For ContainerLog filtering, you can use the link here for more information. The profile will be saved as Custom within the Cost presets list box.

You can also enable Syslog collection for security events on your nodes, but that will increase your Log Analytic costs somewhat, depending on how busy your cluster is!