


This is part 3 in a series of articles on my experiences of deploying Azure Arc enabled data services on Azure Stack HCI AKS.
Part 1 discusses installation of the tools required to deploy and manage the data controller.
Part 2 describes how to deploy and manage a PostgreSQL hyperscale instance.
Part 3 describes how we can monitor our instances from Azure.
In the preview version, if you want to view usage data and metrics for your Arc enabled data services instances, you have to run some manual azdata CLI commands to first dump the data to a JSON file, and another command to upload to your Azure subscription. This can be automated by running it as a scheduled task, or CRON job.
Pre-requisites
Before we can upload and data, we need to make sure that some pre-reqs are in place.
If you’ve been following the previous two parts, the required tools should already be in place : Azure (az) and Azure Data (azdata) CLIs.
We also need to make sure the the necessary resource providers are registered (Microsoft.AzureArcData). Following the instructions here shows how you can do it using the Azure CLI, and is straightforward. The documents don’t show how you can use PowerShell to achieve the same outcome, so here are the commands needed, if you want to try it out :) :
$Subscription = '<your subscriptionName'
$ResourceProviderName = 'Microsoft.AzureArcData'

$AzContext = Get-AzContext

if (-not ($AzContext.Subscription.Name -eq $Subscription)) {
    Login-AzAccount -Subscription $Subscription
}


$resourceProviders = Get-AzResourceProvider -ProviderNamespace $ResourceProviderName
$resourceProviders | Select-Object ProviderNamespace, RegistrationState
$resourceProviders | Where-Object RegistrationState -eq 'NotRegistered' | Register-AzResourceProvider

Get-AzResourceProvider -ProviderNamespace $ResourceProviderName  | Select-Object ProviderNamespace, RegistrationState
The next recommended pre-req is to create a service principal that can be used to automate the upload of the data. This is easy to create using the Azure CLI and as detailed here.
az ad sp create-for-rbac --name azure-arc-metrics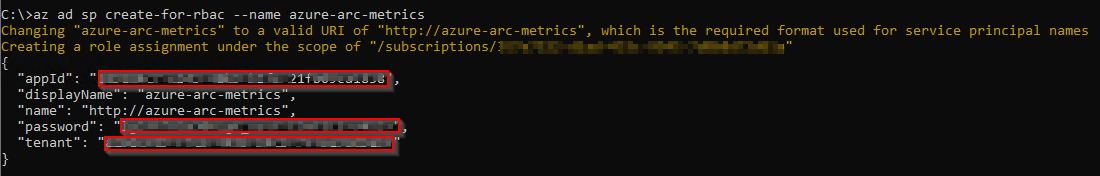
Make a note of the appId (SPN_CLIENT_ID), password (SPN_CLIENT_SECRET) and tenant (SPN_TENANT_ID) values that are returned after the command has been run.
Run the following command to get the Subscription Id.
az account show --query {SubscriptionId:id}Make a note of the output.

The next thing to do is to assign the service principal to the Monitoring Metrics Publisher role in the subscription.
az role assignment create --assignee <appId> --role "Monitoring Metrics Publisher" --scope subscriptions/<Subscription ID>
The last thing to do is to setup a Log Analytics Workspace (if you don’t already have one). Run the following Azure CLI commands to create a resource group and workspace:
az group create --location EastUs --name AzureArcMonitoring
az monitor log-analytics workspace create --resource-group AzureArcMonitoring --workspace-name AzureArcMonitoring
From the output, take note of the Workspace Id.

The last thing we need to retrieve is the shared key for the workspace. Run the following:
az monitor log-analytics workspace get-shared-keys --resource-group AzureArcMonitoring --workspace-name AzureArcMonitoring-demoTake note of the primary or secondary key.

Retrieving data
Retrieving data from our data controller and uploading to Azure is currently a two step process.
The following three commands will export the usage, metrics and log data to your local system:
azdata arc dc export --path c:\temp\arc-dc-usage.json --type usage --force
azdata arc dc export --path c:\temp\arc-dc-metrics.json --type metrics --force
azdata arc dc export --path c:\temp\arc-dc-logs.json --type logs --force
Note: Be careful using the —force switch, as it will overwrite the file specified. If you haven’t uploaded the existing data from that file to Azure, there is a potential you will miss those collected metrics for the period.

The second step, we have to upload the data to our Azure Subscription.
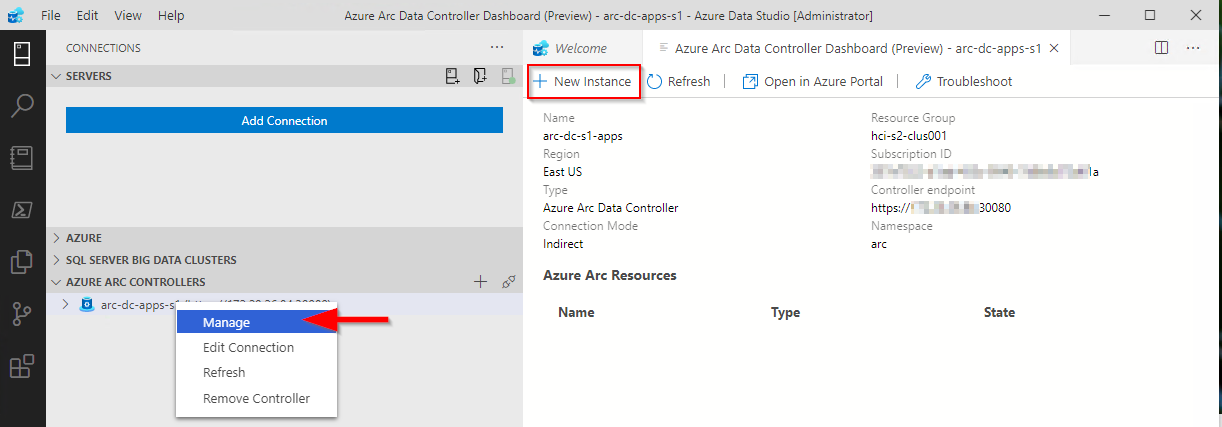
You can check the resource group that the data controller was deployed to via the data controller dashboard in ADS:
Once you have the service principal details, run the following commands:
azdata arc dc upload --path c:\temp\arc-dc-usage.json
azdata arc dc upload --path c:\temp\arc-dc-metrics.json
azdata arc dc upload --path c:\temp\arc-dc-logs.json
For each command. it will prompt for the tenant id, client id and the client secret for the service principal. Azdata currently does not allow you to specify these parameters, but you can set them as Environment variables, so you are not prompted for them. For the log upload, a Log Analytics Workspace ID and secret is required

Here’s an example PowerShell script that you can use to automate the connection to your data controller, retrieve the metrics and also upload to your Azure subscription:
$Env:SPN_AUTHORITY='https://login.microsoftonline.com'
$Env:SPN_TENANT_ID = "<SPN Tenent Id>"
$Env:SPN_CLIENT_ID = "<SPN Client Id>"
$Env:SPN_CLIENT_SECRET ="<SPN Client secret>"
$Env:WORKSPACE_ID = "<Your LogAnalytics Workspace ID"
$Env:WORKSPACE_SHARED_KEY = "<Your LogAnalytics Workspace Shared Key"
$Subscription = "<Your SubscriptionName> "


$Env:AZDATA_USERNAME = "<Data controller admin user>"
$Env:AZDATA_PASSWORD = "<Data controller admin password>"
$DataContollerEP = "https://<DC IP>:30080"

# Find your contexts: kubectl config get-contexts
$kubeContextName = 'my-workload-cluster-admin@my-workload-cluster'

$dataPath = 'c:\temp'

kubectl config use-context $kubeContextName

azdata login -e $DataContollerEP

az login --service-principal -u $Env:SPN_CLIENT_ID -p $Env:SPN_CLIENT_SECRET --tenant $Env:SPN_TENANT_ID

if ($Subscription) {
    az account set --subscription $Subscription
}

if (-not (test-path -path $dataPath)) {
    mkdir $dataPath
}

cd $dataPath

. azdata arc dc export --type metrics --path metrics.json --force
. azdata arc dc upload --path metrics.json

. azdata arc dc export --type usage --path usage.json --force
. azdata arc dc upload --path usage.json

. azdata arc dc export --type logs --path logs.json --force
. azdata arc dc upload --path logs.json
After you have uploaded the data to Azure, you should be able to start to view it in the Azure Portal.
At the time of writing, if you try and use the link from the Azure Arc Data Controller Dashboard in ADS, it will throw an error:


The reason for this is that the URI that is constructed by the ARC extension isn’t targeting the correct resource provider. It uses Microsoft.AzureData, when the correct one is Microsoft.AzureArcData. I assume this will be fixed in an imminent release of the extension soon as I think the namespace has changed very recently. In the meantime, it can be manually patched by doing the following (correct for version 0.6.5 of the Azure Arc extension ) :
Edit:
%USERPROFILE%\.azuredatastudio\extensions\microsoft.arc-0.6.5\dist\extension.jsFind and replace all instances of Microsoft.AzureData with Microsoft.AzureArcData (there should be 4 in total).

If the file has no formatting (due to it being .js) just do the find/replace. I used a VS Code extension (JS-CSS-HTML Formatter) to beautify the formatting as can be seen in the screen grab above.
Save the file and restart the Azure Data Studio Session. When you now click on Open in Azure Portal, it should open as expected.

As it is, we can’t actually do that much from the portal, but enhanced capabilities will come in time
We can view a bit more about out PostgreSQL instances, however, looking similar to the Azure Data Studio Dashboard:

When looking at Metrics, make sure you select the correct namespace - in my example it’s postgres01

The integration with the portal and the uploaded logs is a bit hit and miss. I found that clicking on the Logs link from my resource did not point me to the Log Analytics workspace I specified when I ran my script, so I had to manually target it before I could query the logs.


Thanks for reading this series, and I hope it will help others get around some of the small gotchas I encountered when evaluating this exciting technology stack!